


December 2011
Dear Reader,
Benjamin Franklin said that “time is money” and as market researchers know, time is the key variable that drives the cost of research.
In quantitative research, the length of a survey—that is, the amount of time it takes a respondent to complete a survey—determines most other “time” variables as well: the professional time it takes to design research and analyze data, the fieldwork time it takes to collect data, and the respondent time that requires compensation through incentives.
Versta Research uses and recommends a simple “point” system that accurately predicts survey length. The system is straightforward, easy to learn, and easy to execute. In this newsletter, we teach you the basics of this system.
Other items of interest in this newsletter include:
- 3 Reasons We Don’t Do Statistics in Excel
- Tips for Sampling from Online Panels
- The One Question You Need on Your Survey
- Best Practices for Using Statistics in PR
- The Problem with MaxDiff
- 14 New Findings: Consumer Finance Research
- Nielsen’s Legacy: Tons of Data
- Making Data Apply to Real People
- 7 Ways to Spot Bad Data
We are also delighted to share with you:
If you need help figuring out the ideal survey length that will optimize the value and content of a survey within your budget, please read on, and call us at 312-348-6089 with any additional questions you may have.
Happy Holidays,
The Versta Team
How to Estimate the Length of a Survey
On average it takes 7½ seconds to answer an online survey question. If you keep the questions simple, you can ask eight of them in one minute.
But of course most survey questions are not simple, and few of us can cram eighty questions into a ten minute survey. Most surveys have a mix of simple single choice questions, complex multiple-select questions, grid questions, open-end responses, and numeric answers that require thought and mental calculation. So the key to estimating survey length is knowing the equivalency of question-types vis-à-vis a prototypical short and simple question that takes just 7½ seconds to answer.
Why does all of this matter? Because the cost of a survey, whether you are doing it yourself or hiring an outside provider, is driven largely by time. The cost of designing, programming, testing, fielding, and analyzing data all depend on survey length. Finding respondents who are willing to participate, and the incentives you need to pay them, depend on survey length as well.
More importantly, how useful the data are to management may depend on survey length. Some surveys are too short and critical details go missing, while some surveys are too long with so much data you do not know what to do with it. In addition, how good the data are may depend on survey length. Research shows that data quality declines on surveys that are longer than 20 minutes, so a good rule of thumb is to aim for a survey that takes no more than 15 or 20 minutes to complete.
The Method
Here, then, is a method for estimating survey length that really works and that we have validated against hundreds of different types of surveys over the past several years. Start by creating a tally of “points” for the questionnaire, assigning points to each question or set of questions as follows:
Assign one point for each short and simple survey question that can be read quickly and that has a yes/no response option or easy-to-grasp answer scale.
Here are two examples, each of which counts one point:
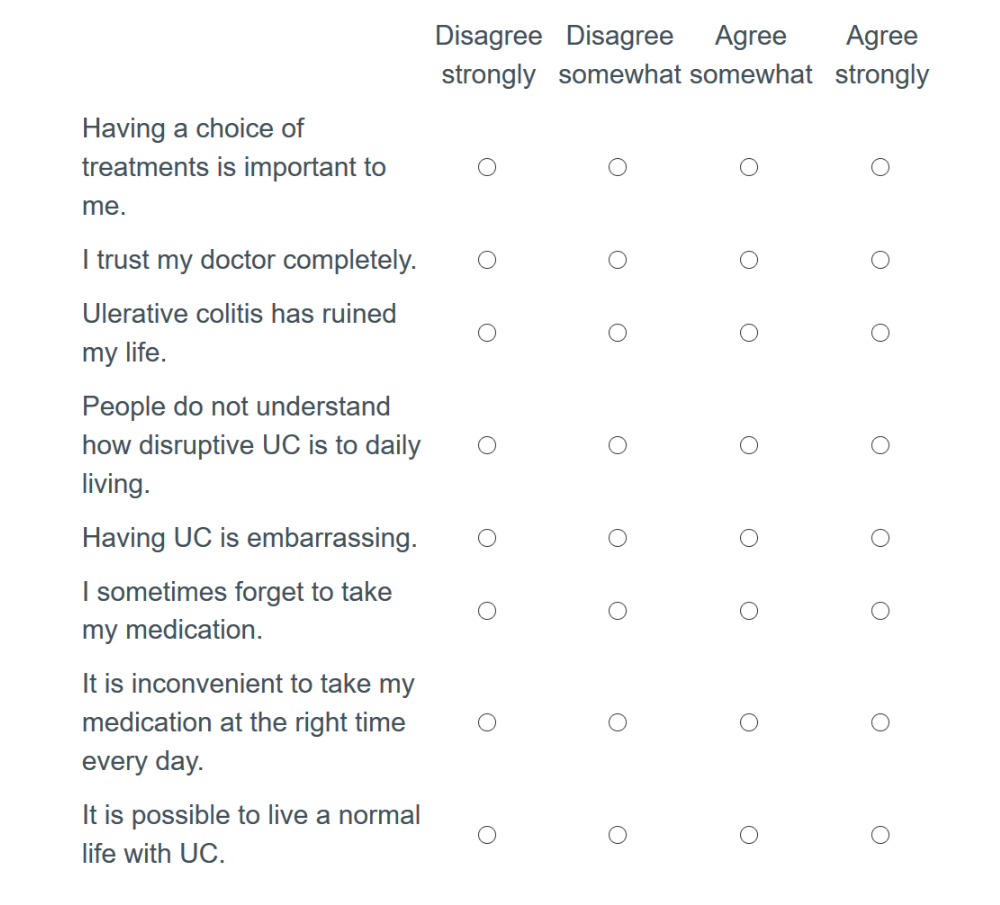
 For questions that are asked in grid format, assign one point for each row of the grid.
For example, the following set of agree/disagree statements counts eight points:
 For multiple response or multiple-select questions, assign one point for every two response options.
As an example, the following question counts four points:
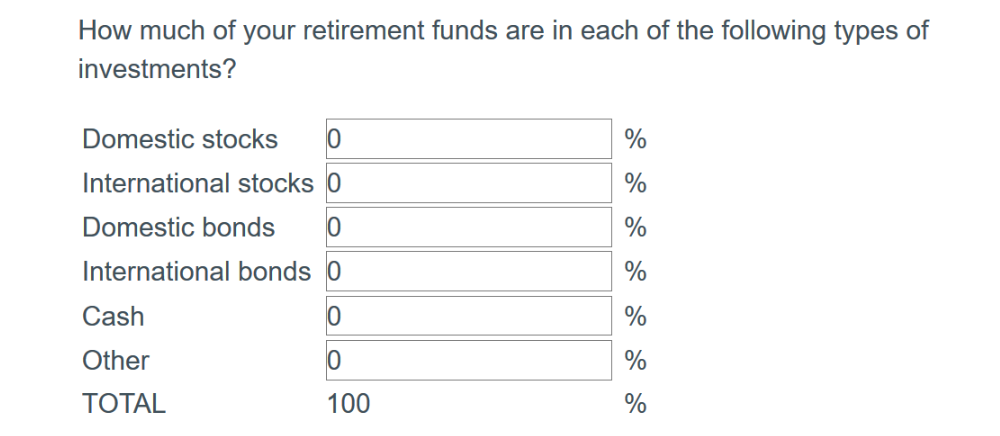
 Assign two points for every response that requires mental calculation. This might include age (many people do a mental calculation based on their year born), or the number of days engaged in specific activities, or allotting percentages or numeric values.
For example, we recommend assigning twelve points to the following question because each answer slot requires a numeric estimate relative to the others, and everything must add to 100%:
 For open-end questions, assign three points for every short phrase or sentence that you expect most respondents will type.
For lengthy instructions, or if any of the questions have a lot of words, assign one point for every three sentences the respondent must read.
Include all questions in the running tally, even if some respondents may not see the questions. An exception is if the skip logic specifies two mutually exclusive paths, in which case you should use only the longer path in the tally.
Once you have the tallied the total number of points, divide by the magic number 8 (this is the number of simple questions you can ask in a one-minute online survey). Voilà, you get the number of minutes it will take most survey respondents to complete your online survey.
What about phone surveys? Well, for that you could divide by 5⅓, which is the number of phone questions you can ask in one minute. But most calculators and spreadsheets don’t do fractions very well and 5⅓ is an awkward number to keep in mind. So instead, stay with the point system outlined above. Divide by 8, then multiple by 1.5 (if you can ask 5⅓ questions in one minute, you can ask 8 questions in one and a half minutes). Presto, you get the number of minutes it will take most survey respondents to complete your survey by phone.
Once you get the hang of it, it will take no more than a few minutes to accurately predict survey length for a majority of respondents, which in turn will allow you to estimate the cost, utility, and data quality of a survey.
There is one drawback to this technique, however. It works so well that unless you teach it to your colleagues, they will likely come to you again and again for help in estimating their survey lengths, leaving you less time to focus on turning your data into a story.
Stories from the Versta Blog
Here are several recent posts from the Versta Research Blog. Click on any headline to read more.
3 Reasons We Don’t Do Statistics in Excel
While Excel has decent functionality for stats, the best market research requires the speed, efficiency, accuracy, and analytical innovation of advanced software.
Tips for Sampling from Online Panels
Online panel surveys can be as rigorous as phone surveys, but it is important to know how panelists are recruited and then directed into your surveys.
The One Question You Need on Your Survey
If you are designing your own customer satisfaction survey, here is the most useful and insightful question you can ask.
Best Practices for Using Statistics in PR
The PRSA and the American Statistical Association have outlined best practices for PR professionals when using and reporting statistics.
The Problem with MaxDiff
MaxDiff is a powerful and popular method among market researchers. But it is not always the best choice for measuring the importance of attributes. Here’s why.
14 New Findings: Consumer Finance Research
The Journal of Marketing Research has published a special issue on consumer financial decision making on topics from managing debt to investing and trading.
Nielsen’s Legacy: Tons of Data
A.C. Nielsen Jr. demonstrated the power of collecting and tracking data. The next frontier in market research will be the interpretation and communication of data.
Making Data Apply to Real People
Reporting statistics can be tricky because some stats (like averages) describe the whole, but do not describe the individual people who make up the whole.
7 Ways to Spot Bad Data
This article outlines seven indicators of potentially bad data you can use to weed out lazy or fraudulent respondents from online surveys.
Versta Research in the News
A Generational Look at Saving for Retirement
Versta Research conducted Fidelity Investments’ 2011 Higher Education Generational Survey, which was featured this week by Time and by the Chronicle of Higher Education, among other media outlets.
Recently Published
PR Professionals Turn to Versta for Survey Expertise
Public Relations Tactics has published its October 2011 issue with a full page article from Versta Research entitled “Telling the whole story: When numbers aren’t enough.” The article describes the difficulties of using traditional numeric scales, common in survey research, for data that needs to tell a story.
MORE VERSTA NEWSLETTERS