


July 2021
Dear Reader,
Imagine a class of undergraduate students in business marketing taking their first—maybe their only—marketing research class. What is the toughest part of research for them? After one lecture and an assignment, we asked them, and nobody said math or statistics.
Our feature article, What Do Gen Z Marketing Students Think about Research?, lays out nine surprises and six challenges that business school marketing students cited about doing marketing research. Their answers may surprise you!
Other items of interest in this newsletter include:
- How to Test Knowledge and Misperceptions on a Survey
- Are They Cheating or Helping? New Research Raises Thorny Issue
- Five Mid-Year Resolutions to Inspire Better Research in 2021
- This is What a McKinsey Survey Looks Like
- How to Fix a McKinsey Survey: 10 Best Practices
- Surprising Ways to Reduce Survey Costs: Pay Respondents First
- Panel Demand Is Outpacing Supply and a Lot of Research Is Failing
- For Better Response Rates, Try Dumping Qualtrics for Mail Chimp
- Finding Fraud in Public Polls: Our AAPOR Presentation
- Tempted to Try SMS Text Message Surveys? Don’t Bother.
We are also delighted to share with you:… which highlights some of our recent work for clients such as Wells Fargo, the American Academy of Dermatology, Fidelity Investments, The Standard, and Lincoln Financial.
As always, feel free to reach out with an inquiry or with questions you may have. We would be pleased to consult with you on your next research effort.
Happy summer,
The Versta Team
What Do Gen Z Marketing Students Think about Research?
Last year we offered a two-week mini-course to undergraduate business marketing students at the University of Illinois in Chicago. The first week consisted of lectures with Q&A, covering the basics of real-world market research and “making research matter.” (Curious? You can watch our 2-minute introductory video on Making Research Matter.)
For the second week, students formed teams and completed a mini-research project of their own. They had to conceptualize, design, execute, analyze, and present it to the class. Yikes—they had never done this before, and they had just one week to finish!
They had never done this before, and they had just one week to finish!
At the end of the mini-course, we asked them to provide written comments answering two questions:
- What was the biggest surprise about research they learned, especially from the lecture?
- What was the hardest part of doing a research project on their own?
With pages of comments from more than sixty Gen Z students in hand, we read them all to find common themes, tallying the most frequently mentioned surprises and challenges.
The Nine Biggest Surprises
- Lay out findings before writing survey questions. A guiding principle for us—and hugely helpful technique—is to have clients write out dream headlines before we jump into questionnaire design. What’s the ideal outcome or number they want to report to their manager? What story would they share with the media, if only we could find that in our data? Students were surprised that beginning with the end in mind means conceptualizing the findings first.
- Dream headlines do not mean confirmation bias. One can lay out hunches and dreams of what the data might say (that is what specifying a hypothesis is all about!) and still avoid confirmation bias. How? By writing unbiased questions, inviting respondents to tell you the opposite, and building a search for “disconfirming evidence” into the research protocols. Good researchers want to know (and are excited by) the truth, even if it runs counter to what they expected to find.
- There is always a good story in the data. Even if dream headlines or ideal outcomes are not supported by one’s data, good research design—driven by dream headlines—pretty much guarantees a good story. This is because it helps you write smart questions relevant to the topic, and truthful answers to those questions matter. We have never had a project fail or end with a shrug, even those that go against initial expectations.
- Words are more powerful than numbers. For reasons we do not fully understand, saying “one-third” has more narrative impact than saying “33%.” Therefore we encourage colleagues (and students) to lean towards fractional words and nouns or adjectives like most or few in their reports, using numbers for data-specific reference. Example: Nearly all students (95%) who attended the mini-course completed their homework assignment on time.
- Data are not the story. When summarizing and reporting, start out with a narrative that does not use statistics or numbers. It helps keep focus on what the data mean, which is the story you want to tell. Then bring in data afterwards as supporting documentation. Data and statistics are never the story; they are simply the proof that the story is true. Same goes for charts and graphs. They should never be the focal point; they should be the proof you show that the story is true.
- Data tell many different stories. Depending on how it is framed, data can be used to tell multiple, even “opposite” stories. A large majority (83%) of our U.S. Olympic athletes are vaccinated. What good role models for our communities! Wait, you mean nearly one in five (17%) are not vaccinated—and yet they’re travelling to Tokyo, in contact with other athletes? What is wrong with them?! A skillful researcher can frame the data to tell whatever relevant, compelling story managers find more useful.
- Use percentages and fractions, not averages. One of the first statistical calculations we learn in school is the mean, or average. But it is tough for people (your audience) to think in averages. Instead, they think in terms of clusters, fractions, and groups of people—for example, half, most, fewer than one in ten, and so on. As such, we rarely report the mean score on survey scales. It is better to report a percentage of respondents who used one end of the scale or the other.
- Numbers are just numbers. One of the dumbest gimmicks newspapers and magazine sometimes use is the formulaic “by the numbers” layout. The headline might be a number, like: 83. Then the supporting copy would say, “The percentage of U.S. athletes who are vaccinated.” But honestly, do you think “83” is interesting? We hope not. It’s just a random number. Even in research, numbers are just numbers, so always keep focused on the story that give those numbers meaning and interest.
- Clients want pretty charts. Students were surprised when we told them that clients value the artistic and design-minded side of what we do. But of course they should! Well-designed charts (with all superfluous decorations removed) are pleasing to look at because they convey data in clear, succinct ways that focus on the story that needs to be told. Good researchers should be involved in chart design just as they must lead the initial survey design.
The Six Biggest Challenges
- Dreaming up Headlines. This was hard for students because, unlike real research, they made up their own projects. It can be hard for researchers, too, but it doesn’t need to be. Just ask your client or the internal team who wants the research to do it for you! Almost always, they have an agenda and a dream. Ask them to specify it. Have them write five to seven dream story headlines of what they hope the research will find.
- Specifying the Data Needed. Once the students had headlines, they needed to work backwards to topics, questions, and measurement scales. At every point they needed to ask, “How will I report this data when finished, and how specifically will it support the narrative I am likely to tell?” We agree, this is one of the biggest challenges of good research, and it will continue to be for their entire careers. It takes lots of experience to know how every data decision is assessed in terms of how it will get reported.
- Writing Good Questions. It was good to hear that students found this one hard. Because it is, indeed, hard if one is focused on the data that will be generated, how it will be reported, and how it will support the findings laid out in dream headlines. And that’s just half the battle. Writing unbiased questions, designed to elicit disconfirming evidence is hard, too. Ideally, these marketing students will never do what most marketing professionals do when they want research: jump into writing survey questions.
- Finding Survey Respondents. You think finding survey respondents is hard? Well, join the club, we say! Your client (in this case the professor) gave you just one week to do it? Welcome to our world! Getting real people (not fraudsters), who meet your screening criteria for inclusion to offer heart-felt opinions about topics that may be of only marginal interest to them is always one of the most challenging aspects of market research. Research panels help, but they do not solve the problem.
- Assembling Data into a Story. Indeed, this is hard too, but it is fun. It’s like an art project that begins with assembling the materials, sifting for the beautiful nuggets that speak to (but do not always confirm) the headlines laid out when you started, distilling each to its essence, pulling them into meaningful wholes, and helping the narrative take shape. If this is something you need to do (and struggle with) yourself, take a look at our “how-to” guide on Turning Data Into Stories®.
- Creating Visuals to Support the Story. This was hard for students because they relied on Microsoft’s default graphics and chart layouts, not quite knowing how to improve them with good design. Choosing effective charts, tables, and infographics, is an important element of doing good research, and it cannot be handed off to programmers at software companies. It requires careful attention to the story, to the nature of the data, and to the comparisons that need to be highlighted.
The overall lesson these marketing students seemed to have learned from our mini-course—evidenced by what they found surprising and hard—is exactly what we hoped for: Doing great research is challenging, but not because math and statistics are hard. It is because great research requires a wide perspective and set of skills that go far beyond math. It requires a deep understanding of people, psychology, narrative, design, science, and logistics.
Doing great research is challenging, but not because math and statistics are hard.
We expect the students in this course will probably become marketing professionals, not researchers. And we hope they remember how tough this assignment was, and will deeply appreciate those researchers in their future who provide them the data, the stories, and the strategic answers they need.
Stories from the Versta Blog
Here are several recent posts from the Versta Research Blog. Click on any headline to read more.
How to Test Knowledge and Misperceptions on a Survey
Surveys are not quizzes, so you need to be careful when writing questions designed to test knowledge. Here are five best practices we recommend.
Are They Cheating or Helping? New Research on Survey “Cheating” Raises Thorny Issue
New research suggests that a third of survey respondents may “cheat” by looking up answers. But that finding likely reflects poor survey design.
Five Mid-Year Resolutions to Inspire Better Research in 2021
Research quality took a battering during the COVID pandemic. Here are 5 ways to refocus efforts and do better research as you return to normal.
This is What a McKinsey Survey Looks Like
This example of a survey from a high-end business consulting firm is proof you are better off hiring a specialized marketing research firm.
How to Fix a McKinsey Survey: 10 Best Practices They Should Have Followed
Lest we get too carried away with criticism, here are some solution-oriented learnings from the mess-of-a-survey we showed you last week.
Surprising Ways to Reduce Survey Costs: Give Respondents Money Before They Take Your Survey
Researchers who built a rigorous survey panel discovered that a “goodwill” payment upfront beats paying an incentive to those who say yes.
Survey Respondent Demand Is Outpacing Supply: That’s Why Your Research Might Be Failing
The COVID-19 pandemic decimated the research industry’s respondent panels. Here’s the impact it is having on our (and your) research today.
For Better Response Rates, Try Dumping Qualtrics for Mail Chimp
Many survey platforms offer capabilities for sending survey invitations, but e-mail services do a better job heading off issues with spam.
Finding Fraud in Public Polls: Our AAPOR Presentation
Versta Research presented at the 76th annual AAPOR conference with a presentation on new methods to detect fraudulent survey respondents.
Tempted to Try SMS Text Message Surveys? Don’t Bother.
Some providers are now trying to sell survey capabilities that work just like mobile text chats. New research shows there are no advantages.
Versta Research in the News
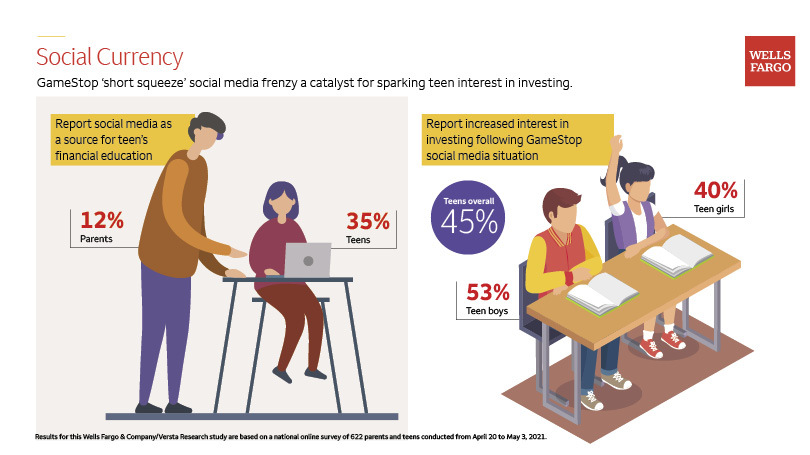
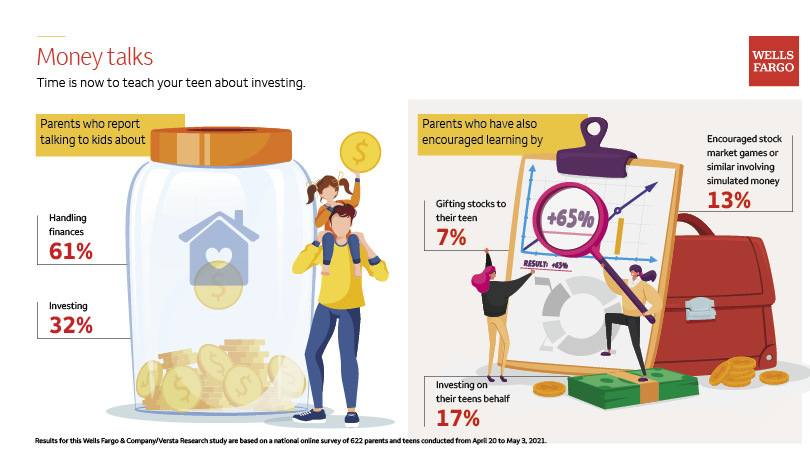
Teen Investing Survey for Wells Fargo
Versta Research fielded a Wells Fargo survey of teenagers and parents of teens about investing, generating news coverage in The New York Times, Reuters, Barron’s, CNBC, and other top media channels. Survey results are summarized on the Wells Fargo website, and via two infographics on Social Currency and Money Talks.
New Research for the American Academy of Dermatology
Versta Research was commissioned to survey American adults about attutides and behaviors around sun protection and skin cancer risk. Findings about sunscreen usage are featured in a recent WebMD news article; findings about skin cancer risks and misperceptions about sun safety have been featured in articles from U.S. News & World Report, NBC News, ABC News, Prevention Magazine, and other media outlets.
The Financial, Emotional, and Professional Costs of Caregiving
Versta Research conducted Fidelity Investments’ 2021 American Caregivers Study, a new research initiative to focus on the costs of caregiving, both emotional and financial; best practices around planning and managing care responsibilities; and lessons to be shared with future caregivers. Findings from the study have so far been featured in Financial Advisor Magazine, and Benefits Pro.
Resource Center Highlights Mental Health Survey Findings
The Standard launched an online resource center for employers called Behavioral Health in the Workplace that features two years-worth of new research based on work by Versta Research. It includes a full array of blog posts, e-books, whitepapers, presentations, podcasts, and infographics with data-rich materials highlighting insights from the research.
Whitepaper Shares Insights from Paid Family Medical Leave Study
The Standard commissioned new research in 2020 to explore how employers are preparing for changes in Paid Family Medical Leave laws. Survey findings are summarized in The Standard’s news release. In addition, The Standard’s PFML Resource Center offers a full-length whitepaper that explores the research findings in depth.
Lincoln Financial Group Showcases New Research on Long-Term Care
New findings from the “2020 LTC Marketing and Thought Leadership Research” that Versta Research conducted for Lincoln Financial Group are featured on Lincoln’s new online resource center for long-term care planning. The research findings are from surveys of both financial advisors and consumers. An infographic download is available for free.
MORE VERSTA NEWSLETTERS