24,000 Absurd Insights from Big Data
A vivid illustration of a statistically spurious relationship is this:
People who wear hats tend to drive slower. But there is no causal relationship, as hats don’t cause people to drive slower. It’s just that older people wear hats more than younger people, and older people tend to drive slower.
That’s actually kind of interesting, and there is a meaningful (if not causal) relationship, such that hats serve as a good predictor of driving speed.
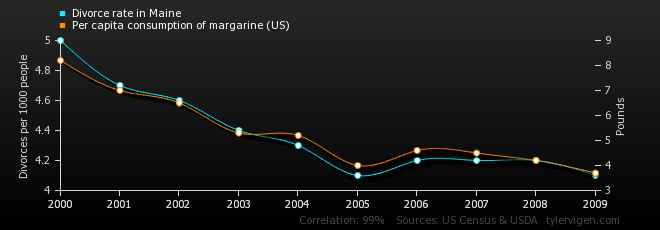
One step further beyond spurious relationships are truly random and absurd relationships, such as the one shown here:
 There are zillions of these, and as the amount of data available to us grows along with our computing capacity to analyze it all, so does our ability to “discover” totally absurd findings like this. In fact, you can easily program an algorithm to search for and find absurd relationships. That’s what Tyler Vigen has done with just a couple of datasets from the US Census Bureau and the CDC, and from which this example of divorce rates and margarine consumption is derived (along with 24,000+ more examples).
This is a compelling reminder of why we should not trust mindless computer algorithms to mine our data and discover “insights” for us—whether it be a sophisticated tool from IBM or a friendly and annoying insights light bulb from Google.


