Election Season’s Dumb Statistics
A favorite pastime in my household is to laugh at the absurd statistics our local weatherman conjures up to make his reports sound dramatic, scientific, and driven by a deep analysis of data. Things like, “These are the first three consecutive days since 1989 of 90+ degree temperatures following an immediately preceding four-week string of record rainfall.” Wow, what an extraordinary event!
Not to be outdone, every four years political journalists and pundits do their best, as well. And we’re not talking about the worst, dumbed-down journalism of BuzzFeed, or others. Here are three recent examples from The New York Times:
In nearly every presidential election since 1952, the candidate who led on Labor Day weekend won (September 5, 2016)
No candidate since 1964 has lost [Ohio] and still won the White House (September 6, 2016) [Update printed on September 7: It’s actually 1960. Yes, 1960!]
And my absolute favorite this season so far:
No presidential candidate has secured a major party nomination after an F.B.I investigation into her use of a private email server. (August 8, 2016).
OMG—never until now?! What an extraordinary election this is. If Hillary Clinton wins this, she’ll crush the forces of history which seem to predict that candidates with inquiries into their private email servers never win.
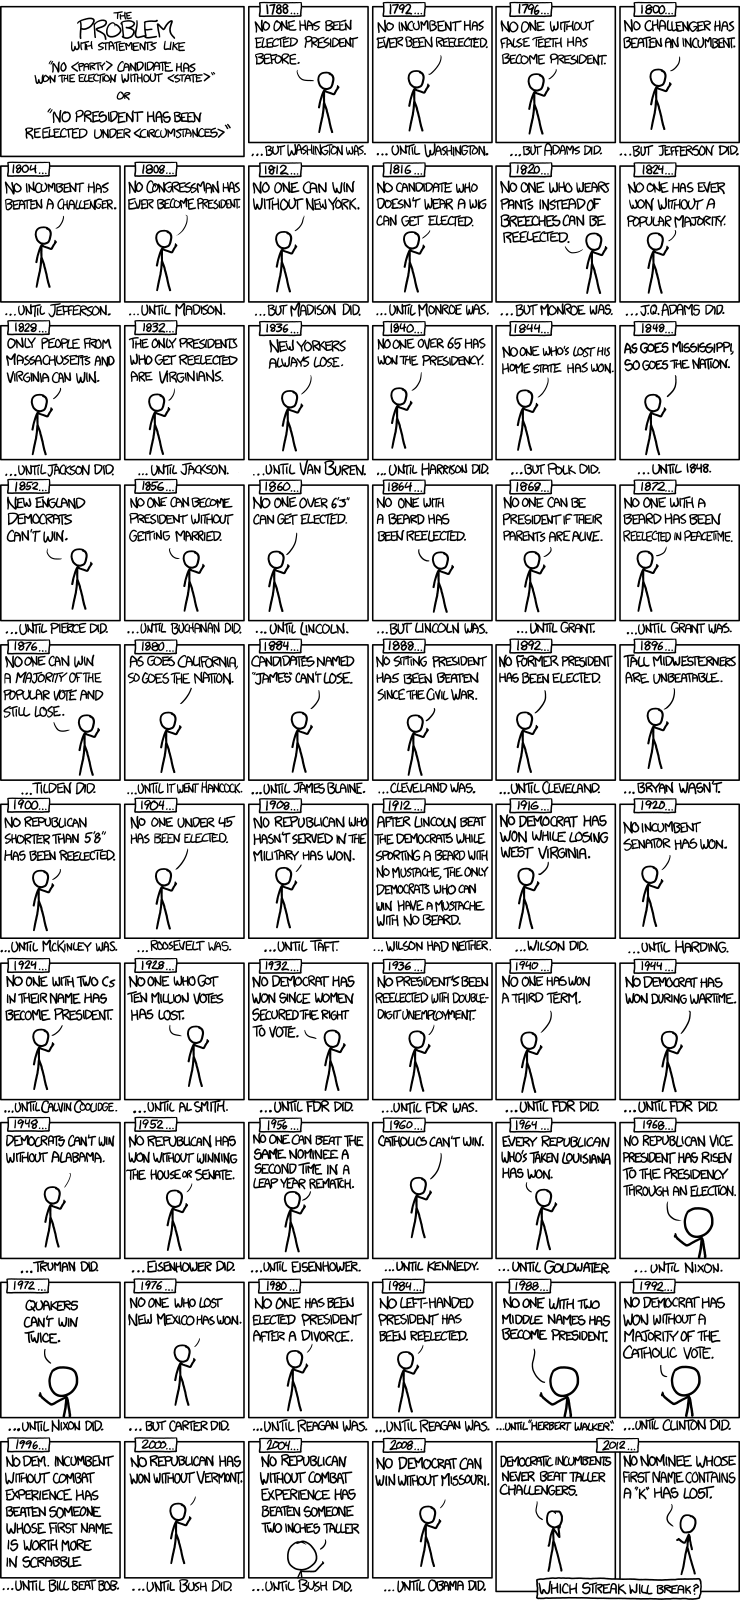
I think she can do it. In fact, it turns out that every presidential candidate since 1788 has crushed at least one force of history, as cartoonist Randall Munroe reminds us with a few more profound stats (see the full cartoon below):
No Democrat has won without a majority of the Catholic vote (until Clinton did)
No Democrat can win without Missouri (until Obama did)
No Republican has won without Vermont (until Bush did)
No Republican has won without winning the house or senate (until Eisenhower did)
No nominee whose first names contains a “k” has lost
All of these “statistics” are pretty absurd, and while I laugh at them, really I should not laugh too hard. They all point to the power of numbers, data, and probabilities to tell a story. Journalists (and readers like us) crave numbers to help us make sense of complexities and probabilities and seemingly endless possibilities.
But if you really want to turn your data into stories, it takes a wee bit more thought, and a wee bit more skill, than citing random strings of mostly meaningless numbers. It is not hard, but it is a skill (and not a magical analytics tool!) developed through years of practice and perspective. Give us a call when you’re ready and we’ll show you how.


