Cool Christmas Drawings with R
Every day I get a digest of new posts from R-Bloggers, a community of 555+ bloggers who are devoted to using R and sharing what they learn with others. Even though you can’t learn how to use R by reading these posts, once you’ve jumped into the world of R with an in-depth tutorial or boot camp, you can learn a ton about R’s amazing functionality by perusing the new titles from this blog every day.
For example, this tree is a fun one for Christmas. One reason that R is quickly becoming the first-choice tool for research data analysis is that it has sophisticated data visualization functionality. With a simple set of programming code it is easy to generate this holiday tree, and then save it as an image.
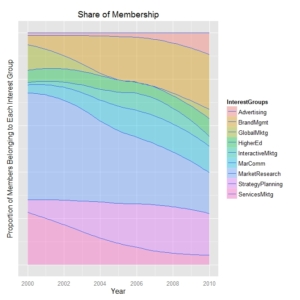
OK, not so useful, except as learning tool, right? But how about this beautiful and useful chart, which I learned how to create by stumbling upon a similar example:
The blogger shared his programming code, and I simply adapted it with new data.
Still not sure that R is the Christmas gift you’ve been waiting for? Looking for something more traditional in the world of survey and market research? Then how about this good old-fashioned phone survey, via last year’s holiday post:
Doing Research on the Night before Christmas
Merry Christmas and Happy Holidays!


