Five Danger Signs When Fielding a Survey
A mistake often made by both professional and do-it-yourself researchers is letting a survey sit in the field without actively monitoring it. Once we design a survey and put it out there for people to respond, we just wait patiently (or get busy on another project) until we have data for analysis, right? But collecting data is never straightforward. It nearly always requires daily adjustments and decisions from the most senior members of a research team.
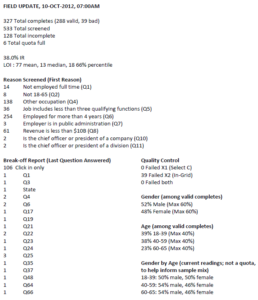
So at Versta Research, all fieldwork we conduct or oversee requires a daily and detailed fieldwork report that gives us visibility into all kinds of technical and conceptual issues that might affect the quality and outcomes of research. Figure 1 shows an example of a report; nothing fancy, but full of crucial data.
As we review these reports, we watch for several warning signs and intervene where needed:
Too many interviews, too fast often means that sampling protocols are not being managed, or that screening questions designed to filter out inappropriate respondents are programmed incorrectly. Rigorous fieldwork is rarely conducted quickly and overnight, largely because doing so would require an (expensive) team of professionals monitoring it at every moment.
Skewed demographics are common in the early phases of fieldwork, but they are a warning sign that we need to correct the sampling protocols. In consumer surveys, we typically monitor cross tabulations of age, gender, and other key demographics. In B2B surveys, we monitor variables like industry and levels of responsibility.
Long or short survey lengths means there is probably something wrong with the survey programming, hosting platform, or that a survey has been invaded by an online survey bot or fraudulent survey takers. How do we know if the survey length is coming in too long or too short? We have a method for estimating survey length and then confirm that median survey length differs by no more than 20% of our estimate.
High quit rates may indicate that technical glitches are preventing people from answering certain questions, and often graphics or java script are the culprits. To identify the problem, we look at how many people quit the survey and where in the survey they quit.
High screen-out rates means there is something wrong with our sampling. We might be targeting the wrong people, which can result from something as simple as having sorted a spreadsheet backwards. Low screen-out rates, on the other hand, often mean that screening questions designed to filter out inappropriate respondents are programmed incorrectly.
We also monitor how many people are passing or failing quality control indicators that we build into our surveys, which gives good information about the instrument itself (is it too burdensome?) and about the quality of our sample (are real respondents offering thoughtful answers?)
Having been burned in the past by lousy fieldwork and sloppy execution, many researchers feel nervous when finally giving the green light for data collection. Instead of feeling nervous, a better approach is to order up a simple daily update of key statistics from incoming data that will allow you to make smart decisions and corrections along the way.
–Joe Hopper, Ph.D.


