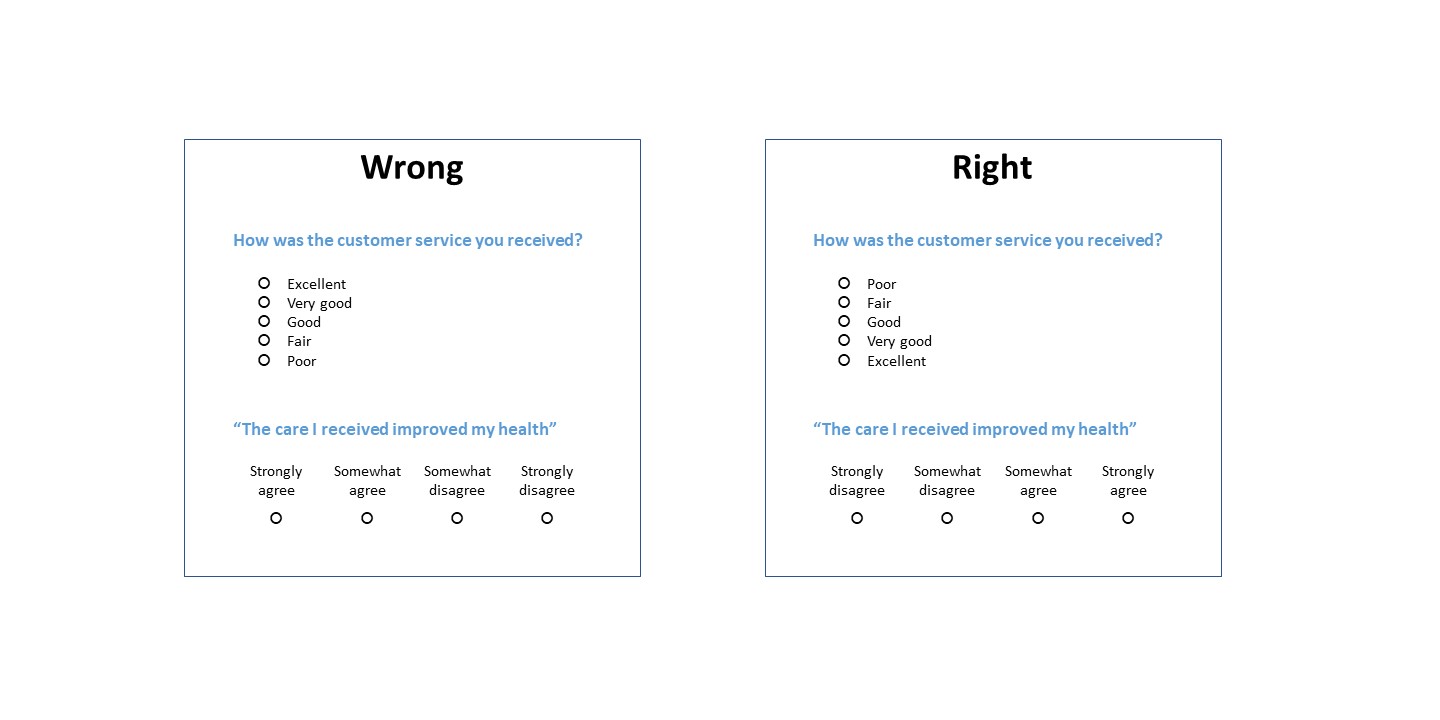
Survey Scales Go from Bad to Good
A simple technique that will measurably improve your data quality is to offer survey response options that go from low to high, or from bad to good. Start with things like terrible, zero, poor, disagree, and so on. Then move towards spectacular, excellent, ten, and agree.
Why? Because there are two important biases at play when people answer survey questions. Laying out scales from bad to good helps them counteract each other.
The first is called social desirability bias. People want to give answers that make them look favorable, pleasant, and positive. So they lean towards the positive and agreeable ends of answer scales even if their experiences are negative. It’s like survey “grade inflation” in a culture that values progress and optimism.
The second is a primacy bias known as anchoring-and-adjustment. Most respondents anchor their thinking on the first response option they see, and then move along a scale until they arrive at a response that fits. There may be two or three responses that come close to fitting, but they stop at the first. This biases answers towards the beginning of a scale.
Laying out scales from negative to positive lets the anchoring-and-adjustment bias (which pulls people to the negative end) counteract the social desirability bias (which pulls people to the positive end). The resulting data will be more valid and will capture more variation.


